Ask your coding agent "what calls BaseAgent.run_async?" and watch what it does. It greps. It gets 69 files back. Then it starts reading them, one at a time, burning context until the window gives up or you do. That's not a reasoning failure. Without a structural index, grep-and-read is the default move.
codebase-memory-mcp claims to be the map: a single static binary that parses your repo into a knowledge graph and lets the agent query structure instead of reading files. The README makes big claims: 99.2% token reduction, sub-millisecond queries, the Linux kernel indexed in three minutes. I spent an evening measuring instead of believing.
Some claims hold up better than the README deserves. Others fall over the moment you point a spec-compliant MCP client at it.
The Setup
Version 0.9.0, on an Apple M5 Pro MacBook Pro with 48GB of memory, running macOS 26.5.2. Two repos I didn't pick at random. They look like work:
| Repo | Content | Size |
|---|---|---|
google/adk-python | 1,709 Python files, 465K LOC | 54MB |
GoogleCloudPlatform/microservices-demo | Go/C#/Python/Node, K8s manifests, Kustomize, Helm, protos | 22MB |
The first is a big single-language codebase. The second is the polyglot microservices mess that platform engineers actually live in. The interesting test is whether the graph can connect a Go frontend to a C# cart service through a .proto file and a pile of Kubernetes YAML.
One number before anything runs: the binary is 273MB. That's the price of "zero dependencies" when you compile 158 tree-sitter grammars and an embedding model into one executable. Fine on a laptop. Think twice before baking it into a CI image you pull on every pipeline run.
Indexing
Full mode, which includes the similarity and semantic-embedding edges:
adk-python 465K LOC, 1,709 files → 18.5s 48,378 nodes 319,418 edges
microservices-demo 22MB polyglot → 0.3s 3,700 nodes 12,030 edgesadk-python 465K LOC, 1,709 files → 18.5s 48,378 nodes 319,418 edges
microservices-demo 22MB polyglot → 0.3s 3,700 nodes 12,030 edgesThat's roughly 25K LOC/second. The README reports a three-minute full index of the 28M LOC Linux kernel; my measured throughput extrapolates to about 19 minutes. Different hardware and codebases make that comparison directional, not conclusive, but I could not reproduce the headline throughput on this workload.
The index lands in ~/.cache/codebase-memory-mcp as one SQLite file per project: 154MB for the 54MB repo. Call it 3x source size on disk. A re-index with no source changes returns in a tenth of a second. That demonstrates a fast no-op path; I didn't separately time a small changed-file update.
The Token Economy, Measured
This is the claim that matters, so I asked one question three ways. What calls BaseAgent.run_async, what does it call, and show me the code.
Graph path: three tool calls, byte-counted from the actual responses:
search_graph query="agent run async execution" 2,742 bytes
trace_path depth=3, both directions 5,528 bytes
get_code_snippet 3,008 bytes
────────────────────────────────────────────────────────────────
3 calls · 11,278 bytes · ~2,800 tokenssearch_graph query="agent run async execution" 2,742 bytes
trace_path depth=3, both directions 5,528 bytes
get_code_snippet 3,008 bytes
────────────────────────────────────────────────────────────────
3 calls · 11,278 bytes · ~2,800 tokensDisciplined agent without a graph: grep with line numbers, then read only the 8 files that define or call the method:
grep -rn run_async src/ 39,344 bytes
read 8 core files 205,942 bytes
────────────────────────────────────────────────────────────────
9 calls · 245,286 bytes · ~61,000 tokensgrep -rn run_async src/ 39,344 bytes
read 8 core files 205,942 bytes
────────────────────────────────────────────────────────────────
9 calls · 245,286 bytes · ~61,000 tokensNaive agent: read all 69 files that grep returned: 5.7MB, roughly 1.4 million token-equivalents using the same four-bytes-per-token estimate. More than most context windows hold, which is why agents in this mode don't finish the question at all.
On this task, the graph returned a 22x smaller response payload than the disciplined baseline and roughly 500x less than the naive full-file read. The README's "99.2% reduction" (about 120x) sits inside that range. I went in expecting marketing arithmetic; the mechanism genuinely delivers, because a call graph returns in one traversal what file-reading reconstructs by exhaustion.
One trap worth knowing: get_architecture with aspects: ["all"] returns 55KB, about 13,700 token-equivalents by the same estimate. An agent that fires it reflexively at session start spends a small essay's worth of context before the first real question. aspects: ["overview"] returns 12KB and covers the same ground. Scope it.
Latency
A full CLI round trip (process start, query, JSON out) completes in 10ms on a warm cache:
$ time codebase-memory-mcp cli query_graph \
'{"project":"adk-python","query":"MATCH (c:Class)-[:INHERITS]->(b) RETURN c.name, b.name LIMIT 5"}'
real 0.01s$ time codebase-memory-mcp cli query_graph \
'{"project":"adk-python","query":"MATCH (c:Class)-[:INHERITS]->(b) RETURN c.name, b.name LIMIT 5"}'
real 0.01sThe README's "under 1ms" refers to query execution inside the server, which I can't isolate from outside, but at 10ms for the whole trip the distinction stops mattering. Latency is not this tool's problem.
What the Graph Actually Knows
The trace_path output for run_async is the thing grep structurally cannot produce: hop-annotated callers across module boundaries:
{"callers":[
{"name":"_run_async_impl","qualified_name":"...ParallelAgent._run_async_impl","hop":1},
{"name":"_run_async_impl","qualified_name":"...LoopAgent._run_async_impl","hop":1},
{"name":"_run_async_impl","qualified_name":"...SequentialAgent._run_async_impl","hop":1},
{"name":"_postprocess_handle_function_calls_async","qualified_name":"...BaseLlmFlow...","hop":1},
{"name":"run_async","qualified_name":"...BaseLlmFlow.run_async","hop":3}
]}{"callers":[
{"name":"_run_async_impl","qualified_name":"...ParallelAgent._run_async_impl","hop":1},
{"name":"_run_async_impl","qualified_name":"...LoopAgent._run_async_impl","hop":1},
{"name":"_run_async_impl","qualified_name":"...SequentialAgent._run_async_impl","hop":1},
{"name":"_postprocess_handle_function_calls_async","qualified_name":"...BaseLlmFlow...","hop":1},
{"name":"run_async","qualified_name":"...BaseLlmFlow.run_async","hop":3}
]}The agent orchestrators relevant to this path, correctly resolved through inheritance, in one call. And each node carries static-analysis metadata I didn't expect: cyclomatic and cognitive complexity, nested-loop depth propagated along call edges (transitive_loop_depth), flags for linear scans inside loops. You can Cypher-query for hot-path candidates across the whole repo in one line.
Now the noise. adk-python ships a bundled, minified Angular app for its dev UI, and the indexer ate it whole. My trace results include callees named Kt, zA and Xo from main-KSQARI5D.js: minified garbage sitting alongside real Python symbols. Version 0.9.0 supports a root-level .cbmignore, so the workaround exists: exclude the generated bundle and re-index. The problem is that the defaults didn't recognise this hashed asset, and the escape hatch was easy to miss.
The UI
Run with --ui=true and a dashboard appears on localhost:9749:
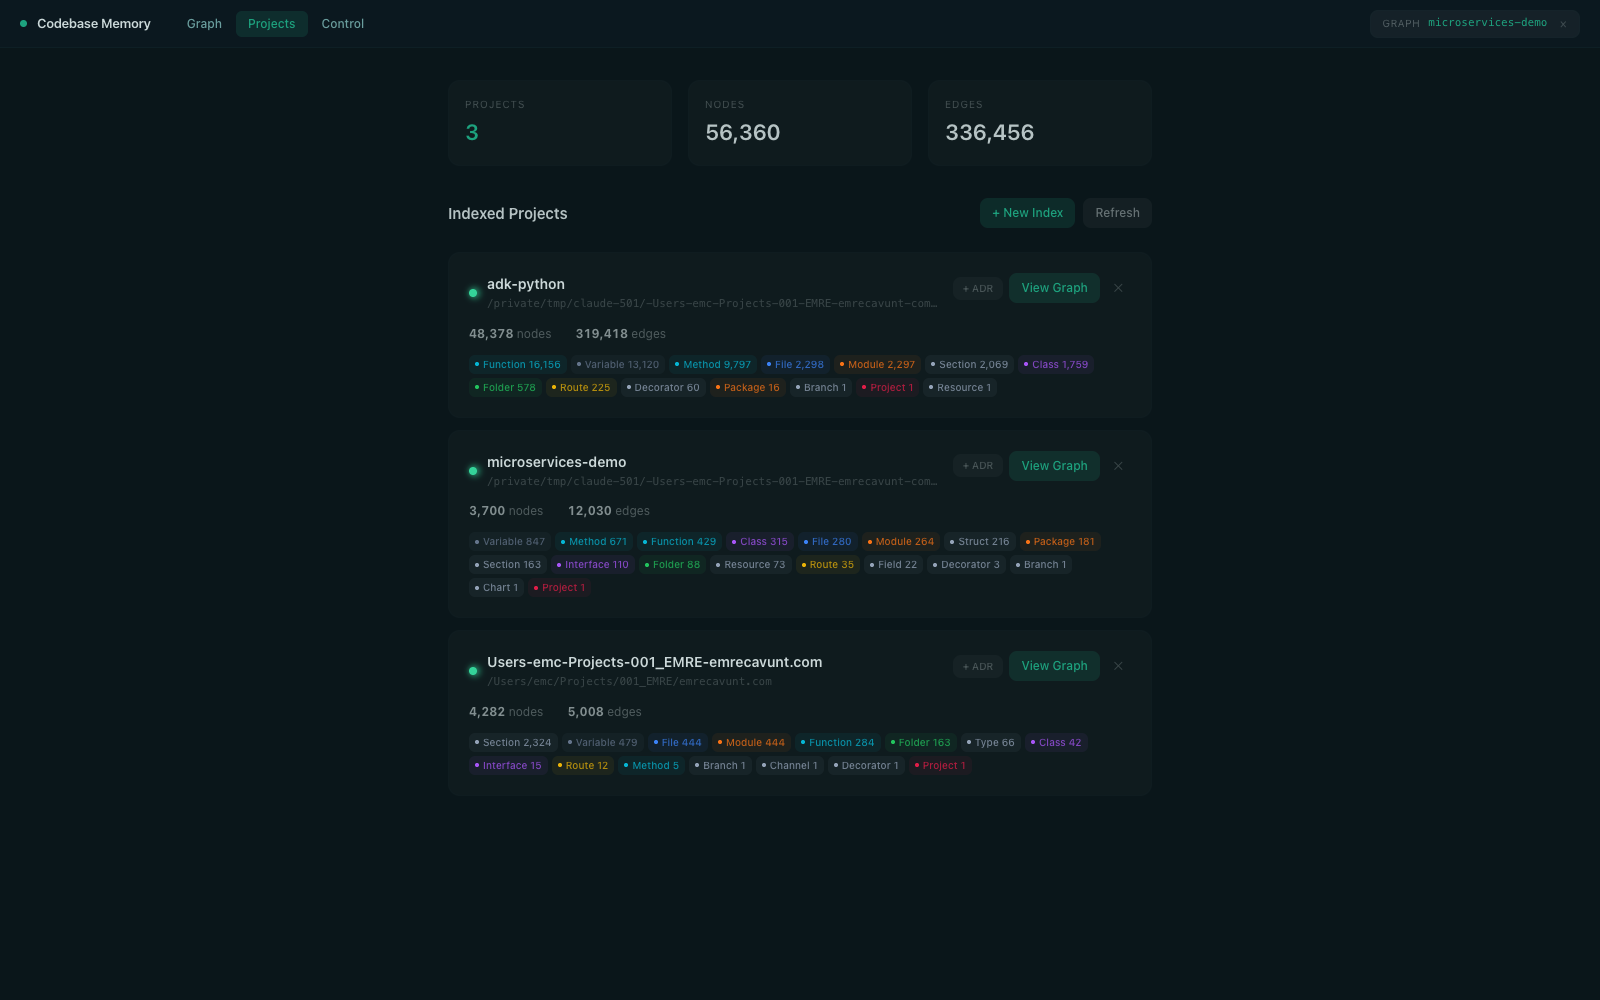
The graph view is the party trick: a WebGL force-directed rendering of the whole codebase, filterable by node type and folder, with a dead-code overlay that flagged 166 unreferenced symbols in microservices-demo:
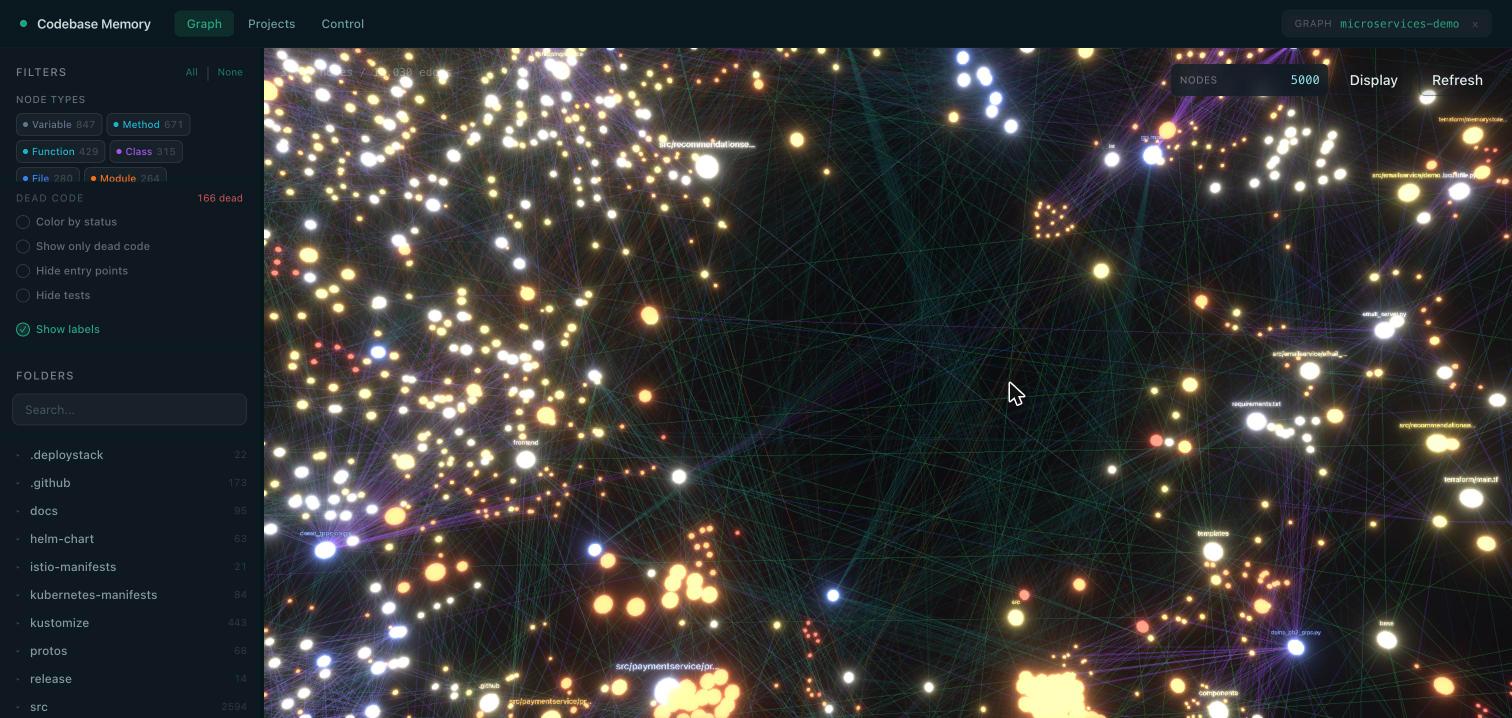
Pretty, and mostly useless for daily work. You don't navigate 48,000 nodes visually. But the dead-code filter and the per-folder drill-down are genuine, and as a way to show a new joiner the actual shape of a system, it beats any architecture diagram that's six months stale.
The Platform Engineering Test
microservices-demo is where I wanted this to shine: 11 services in 5 languages, gRPC everywhere, Kustomize overlays, a Helm chart. The graph schema looks promising:
Resource: 73 (K8s kinds, overlays)
Route: 35 (extracted from .proto files)
GRPC_CALLS: 28 CONFIGURES: 408 INFRA_MAPS: 2Resource: 73 (K8s kinds, overlays)
Route: 35 (extracted from .proto files)
GRPC_CALLS: 28 CONFIGURES: 408 INFRA_MAPS: 2The client side is real. Ask which functions call CartService/GetCart over gRPC and you get the exact Go call sites in frontend and checkoutservice, resolved to a Route node with service and method attached.
Then it dead-ends. The HANDLES edges that should connect that Route to its server implementation point at the vendored proto declarations (adservice's and currencyservice's copies of demo.proto) instead of the actual C# handler in CartService.cs. So a cross_service trace from frontend.getCart never reaches the cart service. And of 73 Kubernetes resources, exactly two got INFRA_MAPS edges linking them to workloads. The question I most wanted answered (which deployment consumes this secret) is precisely the one the graph can't do yet.
The code graph is useful enough for daily navigation. The infra graph still reads like a roadmap preview.
Fact-Checking the README
| Claim | Measured | Verdict |
|---|---|---|
| "99.2% token reduction" | 95.4–99.8% smaller response payloads in this trial | Holds on this task |
| Queries "under 1ms" | 10ms full CLI round trip | Holds in practice |
| Linux kernel full index in 3 min | Extrapolates to ~19 min at my 25K LOC/s | Not reproduced |
| "14 MCP tools" | 14 documented; tools/list returns 8 | Docs hold; discovery fails |
| 11 supported agents | Installer help listed 9 on my machine | Needs reconciliation |
| 3D graph UI on :9749 | Works as advertised | Holds |
The MCP discovery result deserves its own paragraph, because it's the kind of bug that quietly halves the product. I drove the server over raw stdio JSON-RPC as three different client identities: claude-code, cursor, a made-up name. Every one got the same answer: eight tools. The other six (list_projects, index_status, detect_changes, delete_project, manage_adr, ingest_traces) work through the CLI but are absent from tools/list. A client that relies on MCP discovery will never offer them to its agent. detect_changes maps a git diff to a blast radius of affected symbols; it's the feature I'd wire into a PR pipeline tomorrow, and no agent will discover it through this server response.
While you're scripting around that: delete_project executes through the CLI with no application-level confirmation and no undo. One call, index gone. If you expose it to an autonomous agent, put an approval gate or tool allowlist in front of it.
Run It Yourself
Every number above came from commands you can rerun in fifteen minutes. The binary doubles as a CLI (codebase-memory-mcp cli <tool> '<json>'), which removes the agent from the measurement: just bytes on stdout. I didn't preserve the source commit SHAs from the original shallow clones, so expect exact counts to drift as the repositories move. Pin your own commits if you want a reproducible comparison.
Clone the test subjects and index them:
git clone --depth 1 https://github.com/google/adk-python.git
git clone --depth 1 https://github.com/GoogleCloudPlatform/microservices-demo.git
# time a full index (includes similarity + semantic edges)
time codebase-memory-mcp cli index_repository \
'{"repo_path":"'$PWD'/adk-python","name":"adk-python","mode":"full"}'
time codebase-memory-mcp cli index_repository \
'{"repo_path":"'$PWD'/microservices-demo","name":"microservices-demo","mode":"full"}'git clone --depth 1 https://github.com/google/adk-python.git
git clone --depth 1 https://github.com/GoogleCloudPlatform/microservices-demo.git
# time a full index (includes similarity + semantic edges)
time codebase-memory-mcp cli index_repository \
'{"repo_path":"'$PWD'/adk-python","name":"adk-python","mode":"full"}'
time codebase-memory-mcp cli index_repository \
'{"repo_path":"'$PWD'/microservices-demo","name":"microservices-demo","mode":"full"}'The payload benchmark is three tool calls, byte-counted with wc -c. I use four bytes per token as a rough conversion so the results are comparable, but these are response-token estimates rather than tokenizer-exact context costs. They exclude tool schemas, request arguments, and the final answer:
codebase-memory-mcp cli search_graph \
'{"project":"adk-python","query":"agent run async execution","limit":10}' | wc -c
codebase-memory-mcp cli trace_path \
'{"project":"adk-python","function_name":"adk-python.src.google.adk.agents.base_agent.BaseAgent.run_async","depth":3}' | wc -c
codebase-memory-mcp cli get_code_snippet \
'{"project":"adk-python","qualified_name":"adk-python.src.google.adk.agents.base_agent.BaseAgent.run_async"}' | wc -ccodebase-memory-mcp cli search_graph \
'{"project":"adk-python","query":"agent run async execution","limit":10}' | wc -c
codebase-memory-mcp cli trace_path \
'{"project":"adk-python","function_name":"adk-python.src.google.adk.agents.base_agent.BaseAgent.run_async","depth":3}' | wc -c
codebase-memory-mcp cli get_code_snippet \
'{"project":"adk-python","qualified_name":"adk-python.src.google.adk.agents.base_agent.BaseAgent.run_async"}' | wc -cThen the baseline the graph is competing against, measured the same way:
cd adk-python
grep -rl run_async src/ | wc -l # how many files a naive agent reads: 69
grep -rl run_async src/ | xargs wc -c | tail -1 # what that costs: 5.7MB ≈ 1.4M tokens
grep -rn run_async src/ | wc -c # what a disciplined agent's grep costscd adk-python
grep -rl run_async src/ | wc -l # how many files a naive agent reads: 69
grep -rl run_async src/ | xargs wc -c | tail -1 # what that costs: 5.7MB ≈ 1.4M tokens
grep -rn run_async src/ | wc -c # what a disciplined agent's grep costsThe get_architecture trap, quantified:
codebase-memory-mcp cli get_architecture '{"project":"adk-python","aspects":["all"]}' | wc -c # 54,765
codebase-memory-mcp cli get_architecture '{"project":"adk-python","aspects":["overview"]}' | wc -c # 11,728codebase-memory-mcp cli get_architecture '{"project":"adk-python","aspects":["all"]}' | wc -c # 54,765
codebase-memory-mcp cli get_architecture '{"project":"adk-python","aspects":["overview"]}' | wc -c # 11,728And the tools/list probe. This is raw MCP over stdio, no client in between. Swap the clientInfo name for anything you like; the answer doesn't change:
printf '%s\n' \
'{"jsonrpc":"2.0","id":1,"method":"initialize","params":{"protocolVersion":"2024-11-05","capabilities":{},"clientInfo":{"name":"probe","version":"1.0"}}}' \
'{"jsonrpc":"2.0","method":"notifications/initialized"}' \
'{"jsonrpc":"2.0","id":2,"method":"tools/list"}' \
| codebase-memory-mcp 2>/dev/null \
| python3 -c '
import sys, json
for line in sys.stdin:
try: m = json.loads(line)
except ValueError: continue
if m.get("id") == 2:
tools = m["result"]["tools"]
print(len(tools), "tools:", ", ".join(sorted(t["name"] for t in tools)))
'printf '%s\n' \
'{"jsonrpc":"2.0","id":1,"method":"initialize","params":{"protocolVersion":"2024-11-05","capabilities":{},"clientInfo":{"name":"probe","version":"1.0"}}}' \
'{"jsonrpc":"2.0","method":"notifications/initialized"}' \
'{"jsonrpc":"2.0","id":2,"method":"tools/list"}' \
| codebase-memory-mcp 2>/dev/null \
| python3 -c '
import sys, json
for line in sys.stdin:
try: m = json.loads(line)
except ValueError: continue
if m.get("id") == 2:
tools = m["result"]["tools"]
print(len(tools), "tools:", ", ".join(sorted(t["name"] for t in tools)))
'Eight tools come back. The CLI still exposes one that didn't:
codebase-memory-mcp cli list_projects '{}' # works fine; it just isn't advertisedcodebase-memory-mcp cli list_projects '{}' # works fine; it just isn't advertisedTwo warnings before you copy-paste further. delete_project fires through the CLI with no confirmation, so don't expose it to an agent without an approval boundary. And a repeat index_repository on an unchanged repo returns in ~0.1s. If you're timing indexing, time a fresh project name or you're measuring the no-op path.
Verdict
Install it for the code graph. The context economics survived a hostile measurement: a 22x smaller response payload on one real question against one real repo even when the baseline agent plays smart. The result is more structured, not just smaller, because the graph returns hop-annotated call chains that grep alone leaves the agent to reconstruct.
But treat the README's broadest promises as aspirational. MCP discovery hides six of the 14 documented tools, the advertised agent count didn't match the installer help I saw, and the infrastructure story (the one that would matter most to anyone running a platform) is two edges wide. Index your services today; keep your Kubernetes questions in kubectl for a few more releases.
The map is real. The territory it covers is smaller than the legend says.